


Bitcoin has been displaying gradual declines in buying volume, accompanied by notable liquidity grabs and sharp price movements. The discrepancy between the DXY Index and the price has been indicated on the charts, as we saw the gains from the short-term pump get erased 24 hours later.
Venturing beyond the Bitcoin price movement, Solana is further proving the alarming signal that buying and selling orders are giving. What are they you might ask? Let’s dive in.
BITCOIN
We previously covered that the DXY and BTC correlate in terms of price action. It seemed odd to observe the DXY pumping, as well as the biggest currency in the world. That is why a retracement back to lower levels was to be expected. These uncoordinated moves by BTC are a signal of short-term market manipulation and that is why it is vital to use other aspects of the markets such as the DXY Index.
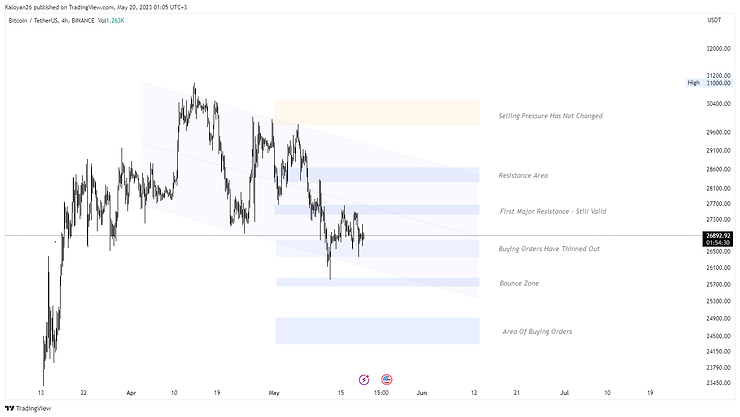
On Friday the orders in the market have moved closer to current price ($26 880), which is an indicator of an upcoming squeeze (market pressure initiated by market makers, so that a currency moves in a direction and then reverses back). These squeezes tend to confuse traders into thinking a new trend has settled. It is important to know that in times like these it is best to map out valid support/resistance areas and wait for a scenario to play out.
On the chart below you can see how close and evenly positioned to the current price the most recent buying/selling orders are. BTC is most likely going to go sideways with little volume until an area of orders has been reached. Looking forward to seeing a retracement shortly after. The buying orders between $26 800 – $26 300 have thinned out but still are valid support for the price.
The First Major Resistance area is still valid, which means that a move above $27 600 is highly unlikely. The sentiment for the crypto market remains bearish until more buying orders appear to support the price. The chart below
As we are approaching the weekend, it is worth noting that the days off are usually open to volatile moves and often not corelated ones. It is a common play in the markets to see a move in a direction for BTC and a correction to the other side in the upcoming week. That is why trading is not preferred.

SOLANA
A similar outcome to that on BTC can be inferred to SOL. The price is trapped between an ex-support and current Minor Resistance and a zone of Minor Support between $20.08 – $20.20. These levels seem negligible to the naked eye, as they are positioned at around 1% from the current price both ways. However, they are important because they are giving us the signal of an upcoming volatile move.
The overall state on the price of SOL has not changed much. There is a significant resistance area between $20.84 – $21.25. The bulls are defending the price between $19.80 – $19.27 with major buying orders.
Looking forward to seeing sideways movement in the price of SOL. A favourable short position can be opened if SOL reaches $20.84 on a green wick up. Accumulating SOL for the long-term vision anywhere in the area where bulls are defending the price is a smart move.
Will be staying out of the charts until a further play out has been indicated. Once again, best to map out the important levels and not enter on a weekend pump/dump move.
